


Professional-Cloud-DevOps-Engineer Exam Questions Dumps, Selling Google Products
Professional-Cloud-DevOps-Engineer Cert Guide PDF 100% Cover Real Exam Questions
To earn the Google Professional-Cloud-DevOps-Engineer certification, you will need to pass a rigorous exam that covers a wide range of topics related to cloud computing, automation, and continuous delivery. Professional-Cloud-DevOps-Engineer exam consists of multiple-choice questions and is designed to evaluate your ability to design, implement, and manage cloud-based solutions using Google Cloud Platform. Professional-Cloud-DevOps-Engineer exam also tests your understanding of various DevOps tools and methodologies, such as Docker, Kubernetes, Ansible, and Jenkins. By passing Professional-Cloud-DevOps-Engineer exam, you will demonstrate your proficiency in using Google Cloud Platform to build and deploy scalable and reliable applications and gain recognition as a certified professional in cloud DevOps engineering.
NEW QUESTION # 37
You are building and deploying a microservice on Cloud Run for your organization Your service is used by many applications internally You are deploying a new release, and you need to test the new version extensively in the staging and production environments You must minimize user and developer impact. What should you do?
- A. Deploy a new environment with the green tag to use as the staging environment Deploy the new version of the service to the green environment and test the new version If the tests pass, send all traffic to the green environment and delete the existing staging environment Repeat for the production environment
- B. Deploy the new version of the service to the staging environment with a new-release tag without serving traffic Test the new-release version If the test passes; gradually roll out this tagged version Repeat for the production environment
- C. Deploy the new version of the service to the staging environment Split the traffic, and allow 1 % of traffic through to the latest version Test the latest version If the test passes gradually roll out the latest version to the staging and production environments
- D. Deploy the new version of the service to the staging environment Split the traffic, and allow 50% of traffic through to the latest version Test the latest version If the test passes, send all traffic to the latest version Repeat for the production environment
Answer: B
Explanation:
Explanation
The best option for deploying a new release of your microservice on Cloud Run and testing it extensively in the staging and production environments with minimal user and developer impact is to deploy the new version of the service to the staging environment with a new-release tag without serving traffic, test the new-release version, and if the test passes, gradually roll out this tagged version. A tag is a label that you can assign to a revision of your service on Cloud Run. You can use tags to create different versions of your service without affecting traffic. You can also use tags to gradually roll out traffic to a new version of your service by using traffic splitting. This way, you can test your new release extensively in both environments and minimize user and developer impact.
NEW QUESTION # 38
You are currently planning how to display Cloud Monitoring metrics for your organization's Google Cloud projects. Your organization has three folders and six projects: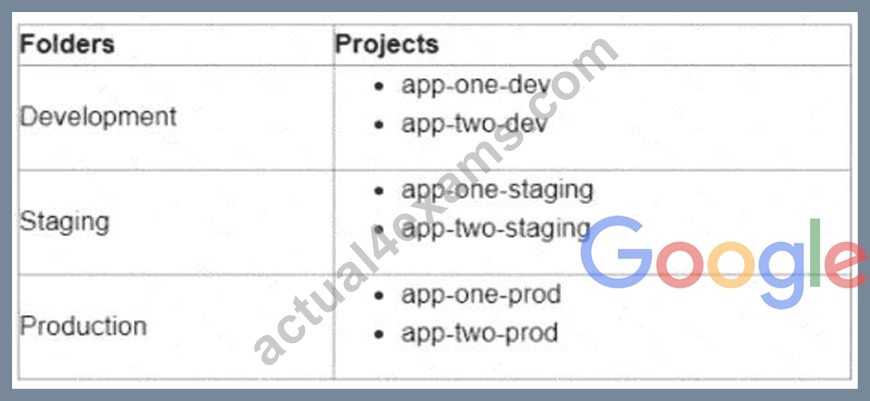
You want to configure Cloud Monitoring dashboards lo only display metrics from the projects within one folder You need to ensure that the dashboards do not display metrics from projects in the other folders You want to follow Google-recommended practices What should you do?
- A. Use the current app-one-dev, app-one-staging and app-one-prod projects as the scoping project for each folder
- B. Create a single new scoping project
- C. Create new scoping projects for each folder
- D. Use the current app-one-prod project as the scoping project
Answer: B
Explanation:
The best option for configuring Cloud Monitoring dashboards to only display metrics from the projects within one folder is to create new scoping projects for each folder. A scoping project is a project that defines which resources are monitored by Cloud Monitoring. You can create new scoping projects for each folder by using the gcloud monitoring register-project command. This way, you can associate each scoping project with a folder and only monitor the resources within that folder. You can then configure Cloud Monitoring dashboards to use the scoping projects as data sources and only display metrics from the projects within one folder.
NEW QUESTION # 39
You work for a healthcare company and regulations require you to create all resources in a United States- based region. You attempted to create a secret in Secret Manager but received the following error message:
The resource cannot be created in the global location due to an organization policy restriction.
You need to resolve the error while remaining compliant with regulations. What should you do?
- A. Create the secret with an automatic replication policy.
- B. Remove the organization policy referenced in the error message.
- C. Add the global region to the organization policy referenced in the error message.
- D. Create the secret with a user-managed replication policy.
Answer: D
Explanation:
To control data residency in Secret Manager, you must use a user-managed replication policy to specify that secrets reside in U.S. regions, satisfying healthcare compliance requirements (e.g., HIPAA, regional residency).
"To ensure that secrets are stored only in certain regions, use user-managed replication."
- Secret Manager Replication Policies
"If an organization policy restricts the use of the global location, use a user-managed replication policy to comply with those restrictions."
- Policy Restrictions on Global Resources
Using user-managed replication allows you to explicitly define U.S. regions while resolving the policy block.
NEW QUESTION # 40
You are creating Cloud Logging sinks to export log entries from Cloud Logging to BigQuery for future analysis Your organization has a Google Cloud folder named Dev that contains development projects and a folder named Prod that contains production projects Log entries for development projects must be exported to dev_dataset. and log entries for production projects must be exported to prod_dataset You need to minimize the number of log sinks created and you want to ensure that the log sinks apply to future projects What should you do?
- A. Create an aggregated Iog sink in the Dev and Prod folders
- B. Create a log sink in each project
- C. Create a single aggregated log sink at the organization level.
- D. Create two aggregated log sinks at the organization level, and filter by project ID
Answer: A
Explanation:
Explanation
The best option for minimizing the number of log sinks created and ensuring that the log sinks apply to future projects is to create an aggregated log sink in the Dev and Prod folders. An aggregated log sink is a log sink that collects logs from multiple sources, such as projects, folders, or organizations. By creating an aggregated log sink in each folder, you can export log entries for development projects to dev_dataset and log entries for production projects to prod_dataset. You can also use filters to specify which logs you want to export.
Additionally, by creating an aggregated log sink at the folder level, you can ensure that the log sink applies to future projects that are created under that folder.
NEW QUESTION # 41
You are managing the production deployment to a set of Google Kubernetes Engine (GKE) clusters. You want to make sure only images which are successfully built by your trusted CI/CD pipeline are deployed to production. What should you do?
- A. Enable Cloud Security Scanner on the clusters.
- B. Set up the Kubernetes Engine clusters with Binary Authorization.
- C. Set up the Kubernetes Engine clusters as private clusters.
- D. Enable Vulnerability Analysis on the Container Registry.
Answer: C
NEW QUESTION # 42
You support a user-facing web application. When analyzing the application's error budget over the previous six months, you notice that the application has never consumed more than 5% of its error budget in any given time window. You hold a Service Level Objective (SLO) review with business stakeholders and confirm that the SLO is set appropriately. You want your application's SLO to more closely reflect its observed reliability.
What steps can you take to further that goal while balancing velocity, reliability, and business needs? (Choose two.)
- A. Tighten the SLO match the application's observed reliability.
- B. Announce planned downtime to consume more error budget, and ensure that users are not depending on a tighter SLO.
- C. Have more frequent or potentially risky application releases.
- D. Implement and measure additional Service Level Indicators (SLIs) fro the application.
- E. Add more serving capacity to all of your application's zones.
Answer: B,D
Explanation:
https://sre.google/sre-book/service-level-objectives/
You want the application's SLO to more closely reflect it's observed reliability. The key here is error budget never goes over 5%. This means they can have additional downtime and still stay within their budget.
NEW QUESTION # 43
Your company recently migrated to Google Cloud. You need to design a fast, reliable, and repeatable solution for your company to provision new projects and basic resources in Google Cloud. What should you do?
- A. Use the Google Cloud console to create projects.
- B. Write a Terraform module and save it in your source control repository. Copy and run the apply command to create the new project.
- C. Write a script by using the gcloud CLI that passes the appropriate parameters from the request. Save the script in a Git repository.
- D. Use the Terraform repositories from the Cloud Foundation Toolkit. Apply the code with appropriate parameters to create the Google Cloud project and related resources.
Answer: D
Explanation:
Terraform is an open-source tool that allows you to define and provision infrastructure as code1. Terraform can be used to create and manage Google Cloud resources, such as projects, networks, and services2. The Cloud Foundation Toolkit is a set of open-source Terraform modules and tools that provide best practices and guidance for deploying Google Cloud infrastructure3. The Cloud Foundation Toolkit includes Terraform repositories for creating Google Cloud projects and related resources, such as IAM policies, APIs, service accounts, and billing4. By using the Terraform repositories from the Cloud Foundation Toolkit, you can design a fast, reliable, and repeatable solution for your company to provision new projects and basic resources in Google Cloud. You can also customize the Terraform code to suit your specific needs and preferences.
NEW QUESTION # 44
Your applications performance in Google Cloud has degraded since the last release You suspect that downstream dependencies might be causing some requests to take longer to complete You need to investigate the issue with your application to determine the cause What should you do?
- A. Configure Error Reporting in your application
- B. Configure Cloud Profiler in your application
- C. Configure Google Cloud Managed Service for Prometheus in your application
- D. Configure Cloud Trace in your application
Answer: D
Explanation:
The best option for investigating the issue with your application's performance in Google Cloud is to configure Cloud Trace in your application. Cloud Trace is a service that allows you to collect and analyze latency data from your application. You can use Cloud Trace to trace requests across different components of your application, such as downstream dependencies, and identify where they take longer to complete. You can also use Cloud Trace to compare latency data across different versions of your application, and detect any performance degradation or improvement. By using Cloud Trace, you can diagnose and troubleshoot performance issues with your application in Google Cloud.
NEW QUESTION # 45
You are running an experiment to see whether your users like a new feature of a web application. Shortly after deploying the feature as a canary release, you receive a spike in the number of 500 errors sent to users, and your monitoring reports show increased latency. You want to quickly minimize the negative impact on users.
What should you do first?
- A. Record data for the postmortem document of the incident.
- B. Roll back the experimental canary release.
- C. Trace the origin of 500 errors and the root cause of increased latency.
- D. Start monitoring latency, traffic, errors, and saturation.
Answer: B
NEW QUESTION # 46
Your application images are built using Cloud Build and pushed to Google Container Registry (GCR). You want to be able to specify a particular version of your application for deployment based on the release version tagged in source control. What should you do when you push the image?
- A. Supply the source control tag as a parameter within the image name.
- B. Reference the image digest in the source control tag.
- C. Use Cloud Build to include the release version tag in the application image.
- D. Use GCR digest versioning to match the image to the tag in source control.
Answer: A
NEW QUESTION # 47
You use Spinnaker to deploy your application and have created a canary deployment stage in the pipeline. Your application has an in-memory cache that loads objects at start time. You want to automate the comparison of the canary version against the production version. How should you configure the canary analysis?
- A. Compare the canary with a new deployment of the previous production version.
- B. Compare the canary with the existing deployment of the current production version.
- C. Compare the canary with a new deployment of the current production version.
- D. Compare the canary with the average performance of a sliding window of previous production versions.
Answer: C
NEW QUESTION # 48
Your company runs services by using multiple globally distributed Google Kubernetes Engine (GKE) clusters Your operations team has set up workload monitoring that uses Prometheus-based tooling for metrics alerts:
and generating dashboards This setup does not provide a method to view metrics globally across all clusters You need to implement a scalable solution to support global Prometheus querying and minimize management overhead What should you do?
- A. Configure Prometheus hierarchical federation for centralized data access
- B. Configure workload metrics within Cloud Operations for GKE
- C. Configure Prometheus cross-service federation for centralized data access
- D. Configure Google Cloud Managed Service for Prometheus
Answer: D
Explanation:
The best option for implementing a scalable solution to support global Prometheus querying and minimize management overhead is to use Google Cloud Managed Service for Prometheus. Google Cloud Managed Service for Prometheus is a fully managed service that allows you to collect, query, and visualize metrics from your GKE clusters using Prometheus-based tooling. You can use Google Cloud Managed Service for Prometheus to query metrics across multiple clusters and regions using a global view. You can also use Google Cloud Managed Service for Prometheus to integrate with other Google Cloud services, such as Cloud Monitoring, Cloud Logging, and BigQuery. By using Google Cloud ManagedService for Prometheus, you can avoid managing and scaling your own Prometheus servers and focus on your application performance.
NEW QUESTION # 49
Your company follows Site Reliability Engineering principles. You are writing a postmortem for an incident, triggered by a software change, that severely affected users. You want to prevent severe incidents from happening in the future. What should you do?
- A. Ensure that test cases that catch errors of this type are run successfully before new software releases.
- B. Follow up with the employees who reviewed the changes and prescribe practices they should follow in the future.
- C. Identify engineers responsible for the incident and escalate to their senior management.
- D. Design a policy that will require on-call teams to immediately call engineers and management to discuss a plan of action if an incident occurs.
Answer: A
Explanation:
Explanation
The best way to prevent severe incidents from happening in the future is to ensure that test cases that catch errors of this type are run successfully before new software releases. This is aligned with the Site Reliability Engineering principle of testing for reliability.
NEW QUESTION # 50
You are analyzing Java applications in production. All applications have Cloud Profiler and Cloud Trace installed and configured by default. You want to determine which applications need performance tuning. What should you do?
Choose 2 answers
- A. 17 Examine the wall-clock time and the CPU time of the application. If the difference is substantial, increase the local disk storage allocation.
- B. O Examine the latency time, the wall-clock time, and the CPU time of the application. If the latency time is slowly burning down the error budget, and the difference between wall-clock time and CPU time is minimal, mark the application for optimization.
- C. Examine the wall-clock time and the CPU time Of the application. If the difference is substantial, increase the CPU resource allocation.
- D. Examine the heap usage Of the application. If the usage is low, mark the application for optimization.
- E. Examine the wall-clock time and the CPU time of the application. If the difference is substantial, increase the memory resource allocation.
Answer: B,C
Explanation:
The correct answers are A and D.
Examine the wall-clock time and the CPU time of the application. If the difference is substantial, increase the CPU resource allocation. This is a good way to determine if the application is CPU-bound, meaning that it spends more time waiting for the CPU than performing actual computation. Increasing the CPU resource allocation can improve the performance of CPU-bound applications1.
Examine the latency time, the wall-clock time, and the CPU time of the application. If the latency time is slowly burning down the error budget, and the difference between wall-clock time and CPU time is minimal, mark the application for optimization. This is a good way to determine if the application is I/O-bound, meaning that it spends more time waiting for input/output operations than performing actual computation.
Increasing the CPU resource allocation will not help I/O-bound applications, and they may need optimization to reduce the number or duration of I/O operations2.
Answer B is incorrect because increasing the memory resource allocation will not help if the application is CPU-bound or I/O-bound. Memory allocation affects how much data the application can store and access in memory, but it does not affect how fast the application can process that data.
Answer C is incorrect because increasing the local disk storage allocation will not help if the application is CPU-bound or I/O-bound. Disk storage affects how much data the application can store and access on disk, but it does not affect how fast the application can process that data.
Answer E is incorrect because examining the heap usage of the application will not help to determine if the application needs performance tuning. Heap usage affects how much memory the application allocates for dynamic objects, but it does not affect how fast the application can process those objects. Moreover, low heap usage does not necessarily mean that the application is inefficient or unoptimized.
NEW QUESTION # 51
You work for a global organization and run a service with an availability target of 99% with limited engineering resources. For the current calendar month you noticed that the service has 99 5% availability.
You must ensure that your service meets the defined availability goals and can react to business changes including the upcoming launch of new features You also need to reduce technical debt while minimizing operational costs You want to follow Google-recommended practices What should you do?
- A. Identify, measure and eliminate toil by automating repetitive tasks
- B. Define an error budget for your service level availability and minimize the remaining error budget
- C. Add N+1 redundancy to your service by adding additional compute resources to the service
- D. Allocate available engineers to the feature backlog while you ensure that the sen/ice remains within the availability target
Answer: A
NEW QUESTION # 52
Your development team has created a new version of their service's API. You need to deploy the new versions of the API with the least disruption to third-party developers and end users of third-party installed applications. What should you do?
- A. Announce deprecation of the old version of the API.
Introduce the new version of the API.
Contact remaining users on the old API.
Deprecate the old version of the API.
Turn down the old version of the API.
Provide best effort support to users of the old API. - B. Announce deprecation of the old version of the API.
Contact remaining users on the old API.
Introduce the new version of the API.
Deprecate the old version of the API.
Provide best effort support to users of the old API.
Turn down the old version of the API. - C. Introduce the new version of the API.
Contact remaining users of the old API.
Announce deprecation of the old version of the API.
Deprecate the old version of the API.
Turn down the old version of the API.
Provide best effort support to users of the old API. - D. Introduce the new version of the API.
Announce deprecation of the old version of the API.
Deprecate the old version of the API.
Contact remaining users of the old API.
Provide best effort support to users of the old API.
Turn down the old version of the API.
Answer: D
NEW QUESTION # 53
You are developing reusable infrastructure as code modules. Each module contains integration tests that launch the module in a test project. You are using GitHub for source control. You need to Continuously test your feature branch and ensure that all code is tested before changes are accepted. You need to implement a solution to automate the integration tests. What should you do?
- A. Ask the pull request reviewers to run the integration tests before approving the code.
- B. Use Cloud Build to run the tests. Trigger all tests to run after a pull request is merged.
- C. Use a Jenkins server for Cl/CD pipelines. Periodically run all tests in the feature branch.
- D. Use Cloud Build to run tests in a specific folder. Trigger Cloud Build for every GitHub pull request.
Answer: D
Explanation:
Cloud Build is a service that executes your builds on Google Cloud Platform infrastructure. Cloud Build can import source code from Google Cloud Storage, Cloud Source Repositories, GitHub, or Bitbucket, execute a build to your specifications, and produce artifacts such as Docker containers or Java archives1. Cloud Build can also run integration tests as part of your build steps2.
You can use Cloud Build to run tests in a specific folder by specifying the path to the folder in the dir field of your build step3. For example, if you have a folder named tests that contains your integration tests, you can use the following build step to run them:
steps:
- name: 'gcr.io/cloud-builders/go'
args: ['test', '-v']
dir: 'tests'
Copy
You can use Cloud Build to trigger builds for every GitHub pull request by using the Cloud Build GitHub app. The app allows you to automatically build on Git pushes and pull requests and view your build results on GitHub and Google Cloud console4. You can configure the app to run builds on specific branches, tags, or paths5. For example, if you want to run builds on pull requests that target the master branch, you can use the following trigger configuration:
includedFiles:
- '**'
name: 'pull-request-trigger'
github:
name: 'my-repo'
owner: 'my-org'
pullRequest:
branch: '^master$'
Using Cloud Build to run tests in a specific folder and trigger builds for every GitHub pull request is a good way to continuously test your feature branch and ensure that all code is tested before changes are accepted. This way, you can catch any errors or bugs early and prevent them from affecting the main branch.
Using a Jenkins server for CI/CD pipelines is not a bad option, but it would require more setup and maintenance than using Cloud Build, which is fully managed by Google Cloud. Periodically running all tests in the feature branch is not as efficient as running tests for every pull request, as it may delay the feedback loop and increase the risk of conflicts or failures.
Using Cloud Build to run the tests after a pull request is merged is not a good practice, as it may introduce errors or bugs into the main branch that could have been prevented by testing before merging.
Asking the pull request reviewers to run the integration tests before approving the code is not a reliable way of ensuring code quality, as it depends on human intervention and may be prone to errors or oversights.
Reference:
1: Overview | Cloud Build Documentation | Google Cloud
2: Running integration tests | Cloud Build Documentation | Google Cloud
3: Build configuration overview | Cloud Build Documentation | Google Cloud
4: Building repositories from GitHub | Cloud Build Documentation | Google Cloud
5: Creating GitHub app triggers | Cloud Build Documentation | Google Cloud
NEW QUESTION # 54
You manage several production systems that run on Compute Engine in the same Google Cloud Platform (GCP) project. Each system has its own set of dedicated Compute Engine instances. You want to know how must it costs to run each of the systems. What should you do?
- A. Name each virtual machine (VM) after the system it runs. Set up a usage report export to a Cloud Storage bucket. Configure the bucket as a source in BigQuery to query costs based on VM name.
- B. In the Google Cloud Platform Console, use the Cost Breakdown section to visualize the costs per system.
- C. Assign all instances a label specific to the system they run. Configure BigQuery billing export and query costs per label.
- D. Enrich all instances with metadata specific to the system they run. Configure Stackdriver Logging to export to BigQuery, and query costs based on the metadata.
Answer: C
NEW QUESTION # 55
You support a large service with a well-defined Service Level Objective (SLO). The development team deploys new releases of the service multiple times a week. If a major incident causes the service to miss its SLO, you want the development team to shift its focus from working on features to improving service reliability. What should you do before a major incident occurs?
- A. Negotiate with the product team to always prioritize service reliability over releasing new features.
- B. Develop an appropriate error budget policy in cooperation with all service stakeholders.
- C. Add a plugin to your Jenkins pipeline that prevents new releases whenever your service is out of SLO.
- D. Negotiate with the development team to reduce the release frequency to no more than once a week.
Answer: B
NEW QUESTION # 56
You are using Stackdriver to monitor applications hosted on Google Cloud Platform (GCP). You recently deployed a new application, but its logs are not appearing on the Stackdriver dashboard.
You need to troubleshoot the issue. What should you do?
- A. Confirm that port 25 has been opened in the firewall to allow messages through to Stackdriver.
- B. Confirm that the Stackdriver agent has been installed in the hosting virtual machine.
- C. Confirm that your account has the proper permissions to use the Stackdriver dashboard.
- D. Confirm that the application is using the required client library and the service account key has proper permissions.
Answer: B
Explanation:
https://cloud.google.com/monitoring/agent/monitoring/troubleshooting#checklist
NEW QUESTION # 57
......
Pass Professional-Cloud-DevOps-Engineer Exam - Real Questions and Answers: https://www.actual4exams.com/Professional-Cloud-DevOps-Engineer-valid-dump.html
Pass Professional-Cloud-DevOps-Engineer Review Guide, Reliable Professional-Cloud-DevOps-Engineer Test Engine: https://drive.google.com/open?id=1siilmUn6xwQHX6xiCHFkAqcKYO0sEGOM